Methods for Analyzing Culturomics Data
Culturomics analyses usually draw on a wide range of statistical methods to describe, classify, and make inferences from corpus metrics. Descriptive statistics can be used to summarize the main features of the data, often supported by graphical methods, such as histograms, box plots, and scatter plots. Topic modeling is also a useful method for text corpora that may be used in a preliminary stage to identify relevant data for further analysis and storage or as the focus of analysis to identify the core topics in the corpus. Network analysis can be used to analyze the co-occurrence patterns of entities in the corpus or be combined with topic modeling to explore connections between key topics. Regression-analysis methods, from generalized linear models to machine learning models, can help researchers make inferences on how culturomics metrics relate to other variables of interest,
which usually include biological, social, cultural, and geographical factors. These methods can be used to identify traits driving species popularity in the public eye or landscape factors associated with public preferences for protected areas.
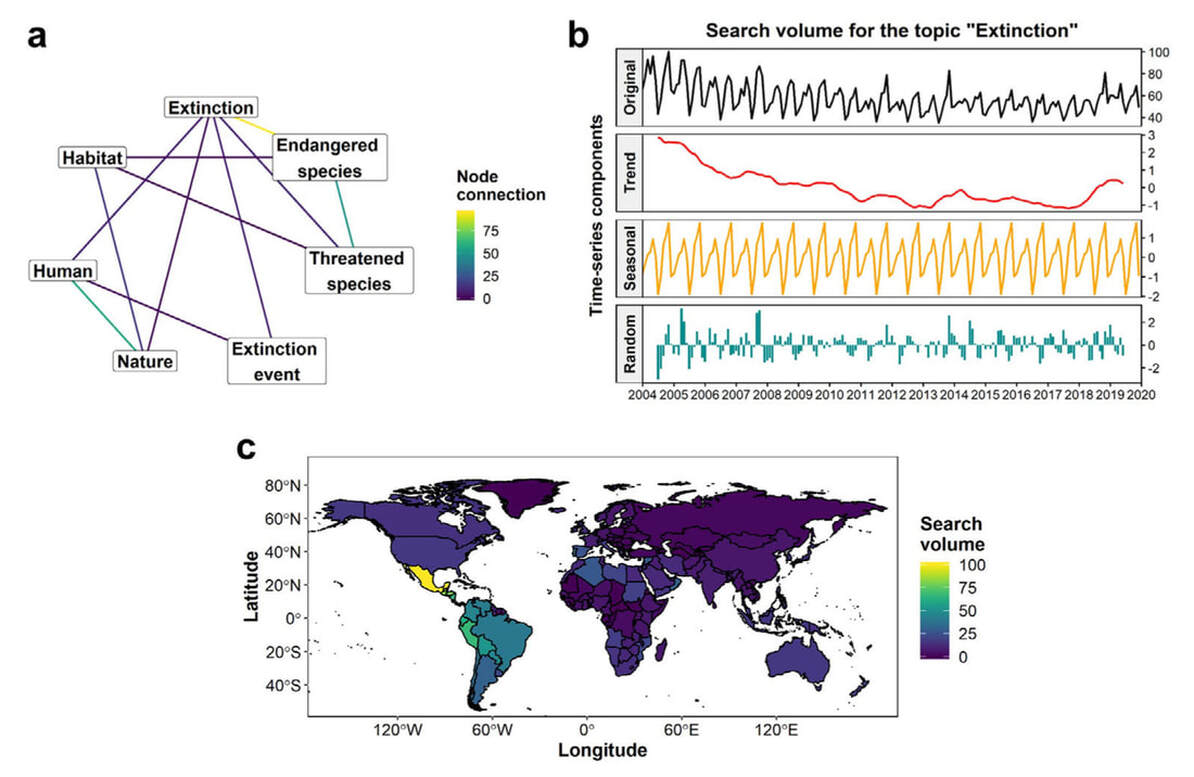
In temporal analyses of culturomics data, time series plots can help researchers explore and visualize temporal patterns in the data. Long time-series data are usually composed of long-term trends, short-term cyclical and seasonal variation, and a random component. Methods to decompose time-series data to its multiple elements can be used to explore each component in detail. Autocorrelation functions can be used to explore the existence of temporal dependence in the time-series data, and cross-correlation functions are useful for exploring the relationship between multiple time series of interest. These functions can be used, for instance, to explore the temporal relationship between online news and public interest in conservation topics and charismatic species. Autoregressive integrated moving average models are commonly used to explore time-series data, but there are a range of other modeling approaches available, including machine learning-based methods. Approaches based on change-point detection can identify shifts in temporal trends over time and be used to explore the role of specific events in influencing public interest trends toward conservation topics. In such cases, adopting a counterfactual approach to the analysis may help generate more robust inferences from the data.
Spatial analyses of culturomics data commonly involve the use of geographical information systems to visualize and map location- and area-based data. Point-location data can be plotted directly on a map or summarized over relevant spatial areas with point-density analysis and plotted using heat maps. Area- or region-based data can also be mapped onto the relevant spatial units with choropleth, cartogram, or proportional symbol maps. Bivariate maps can be used when the analysis focuses on more than 1 spatial variable. In such cases, spatial modeling methods ranging from geographically weighted regression, to generalized additive models, to Bayesian spatial modeling may be used to statistically explore the relationship between variables.
More information on data analysis for conservation culturomics research can be found in Correia et al. 2021.
Examples of culturomics data analysis based on (a) network analysis, (b) time-series decomposition, and (c) choropleth maps. The examples are based on data obtained from Google Trends for the topic extinction (interest over time, interest by region, and top related topics) to demonstrate the range of analytical options available for data extracted from a single corpus.

